Clustering Performance Evaluation
Clustering Performance Evaluation
Clustering Performance Evaluation
为了评估聚类结果的好坏,需要制定相应的指标进行评估。
常用的指标可以分为两大类,一类是与标注的类(分类)进行对比分析,相似度越大越好,一类是直接评估聚类结果的可区分度。
Evaluating the performance of a clustering algorithm is not as trivial as counting the number of errors or the precision and recall of a supervised classification algorithm. In particular any evaluation metric should not take the absolute values of the cluster labels into account but rather if this clustering define separations of the data similar to some ground truth set of classes or satisfying some assumption such that members belong to the same class are more similar that members of different classes according to some similarity metric.
Adjusted Rand index
Adjusted Rand指数说明如下。
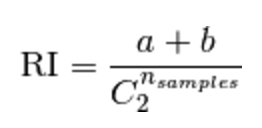
If C is a ground truth class assignment and K the clustering, let us define a and b as:
a, the number of pairs of elements that are in the same set in C and in the same set in K
b, the number of pairs of elements that are in different sets in C and in different sets in K
The raw (unadjusted) Rand index is then given by:

Adjusted Rand直接通过实例对类的指派(assignments)和标注的类(分类)的差异大小,反映出聚类结果的好坏。
Given the knowledge of the ground truth class assignments labelstrue and our clustering algorithm assignments of the same samples labelspred, the adjusted Rand index is a function that measures the similarity of the two assignments, ignoring permutations and with chance normalization.
To counter this effect we can discount the expected RI of random labelings by defining the adjusted Rand index as follows:

其优缺点分析如下。
Advantages:
- Random (uniform) label assignments have a ARI score close to 0.0 for any value of nclusters and nsamples (which is not the case for raw Rand index or the V-measure for instance).
- Bounded range [-1, 1]: negative values are bad (independent labelings), similar clusterings have a positive ARI, 1.0 is the perfect match score.
- No assumption is made on the cluster structure: can be used to compare clustering algorithms such as k-means which assumes isotropic blob shapes with results of spectral clustering algorithms which can find cluster with "folded" shapes.
Drawbacks:
- Contrary to inertia, ARI requires knowledge of the ground truth classes while is almost never available in practice or requires manual assignment by human annotators (as in the supervised learning setting).
Mutual Information based scores
Mutual Information based scores同Adjusted Rand Index类似,能够反映出聚类结果和标注的类(分类)的差异性大小,但原理基于信息熵度量,即分布的相似度。
Given the knowledge of the ground truth class assignments labelstrue and our clustering algorithm assignments of the same samples labelspred, the Mutual Information is a function that measures the agreement of the two assignments, ignoring permutations. Two different normalized versions of this measure are available, Normalized Mutual Information(NMI) and Adjusted Mutual Information(AMI). NMI is often used in the literature while AMI was proposed more recently and is normalized against chance.
其计算过程如下。
The mutual information (MI) between U and V is calculated by:

The normalized mutual information is defined as

Using the expected value, the adjusted mutual information can then be calculated using a similar form to that of the adjusted Rand index:

其优缺点分析如下。
Advantages:
- Random (uniform) label assignments have a AMI score close to 0.0 for any value of nclusters and nsamples (which is not the case for raw Mutual Information or the V-measure for instance).
- Bounded range [0, 1]: Values close to zero indicate two label assignments that are largely independent, while values close to one indicate significant agreement. Further, values of exactly 0 indicate purely independent label assignments and a AMI of exactly 1 indicates that the two label assignments are equal (with or without permutation).
- No assumption is made on the cluster structure: can be used to compare clustering algorithms such as k-means which assumes isotropic blob shapes with results of spectral clustering algorithms which can find cluster with “folded” shapes.
Drawbacks:
- Contrary to inertia, MI-based measures require the knowledge of the ground truth classes while almost never available in practice or requires manual assignment by human annotators (as in the supervised learning setting).
- NMI and MI are not adjusted against chance.
Homogeneity, completeness and V-measure
Homogeneity, completeness and V-measure基于条件熵(conditional entropy analysis)和启发式对相似度进行定义。
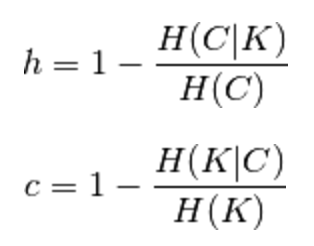
Given the knowledge of the ground truth class assignments of the samples, it is possible to define some intuitive metric using conditional entropy analysis. In particular Rosenberg and Hirschberg (2007) define the following two desirable objectives for any cluster assignment:
homogeneity和completeness的解释和计算如下。
- homogeneity: each cluster contains only members of a single class.
- completeness: all members of a given class are assigned to the same cluster.
Homogeneity and completeness scores are formally given by:

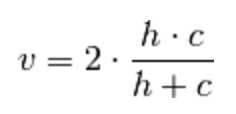
V-measure是前两者的调和平均,其计算如下。
Rosenberg and Hirschberg further define V-measure as the harmonic mean of homogeneity and completeness:

其优缺点分析如下。
Advantages:
- Bounded scores: 0.0 is as bad as it can be, 1.0 is a perfect score.
- Intuitive interpretation: clustering with bad V-measure can be qualitatively analyzed in terms of homogeneity and completeness to better feel what ‘kind’ of mistakes is done by the assignment.
- No assumption is made on the cluster structure: can be used to compare clustering algorithms such as k-means which assumes isotropic blob shapes with results of spectral clustering algorithms which can find cluster with “folded” shapes.
Drawbacks:
- The previously introduced metrics are not normalized with regards to random labeling: this means that depending on the number of samples, clusters and ground truth classes, a completely random labeling will not always yield the same values for homogeneity, completeness and hence v-measure. In particular random labeling won’t yield zero scores especially when the number of clusters is large.
- This problem can safely be ignored when the number of samples is more than a thousand and the number of clusters is less than 10. For smaller sample sizes or larger number of clusters it is safer to use an adjusted index such as the Adjusted Rand Index (ARI).
Silhouette Coefficient
不同于之前的评估方法,轮廓系数(Silhouette Coefficient)直接评估聚类结果的可区分度,即类内部的相似度越大越好,不同类的相似度越小越好,也即类的轮廓越清晰越好。
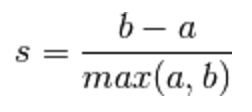
If the ground truth labels are not known, evaluation must be performed using the model itself. The Silhouette Coefficient is an example of such an evaluation, where a higher Silhouette Coefficient score relates to a model with better defined clusters. The Silhouette Coefficient is defined for each sample and is composed of two scores:
其计算过程如下。
- a: The mean distance between a sample and all other points in the same class.
- b: The mean distance between a sample and all other points in the next nearest cluster.
The Silhouette Coefficient s for a single sample is then given as:

其优缺点分析如下。
Advantages:
- The score is bounded between -1 for incorrect clustering and +1 for highly dense clustering. Scores around zero indicate overlapping clusters.
- The score is higher when clusters are dense and well separated, which relates to a standard concept of a cluster.
Drawbacks:
- The Silhouette Coefficient is generally higher for convex clusters than other concepts of clusters, such as density based clusters like those obtained through DBSCAN.
相关连接
- http://nlp.stanford.edu/IR-book/html/htmledition/evaluation-of-clustering-1.html
- http://scikit-learn.org/stable/modules/clustering.html#clustering-performance-evaluation